ATLAS OF EXTREME CLIMATE

LEARNED FROM EXTREME CLIMATES
When disaster becomes data, what happens to perception?
LEARNED FROM EXTREME CLIMATES
Extreme events increasingly reshape cities and our sense of a collective future. As floods, heatwaves, typhoons, wildfires and landslides are repeatedly reduced to statistics and headlines, I began to ask whether we are losing our emotional connection to them.
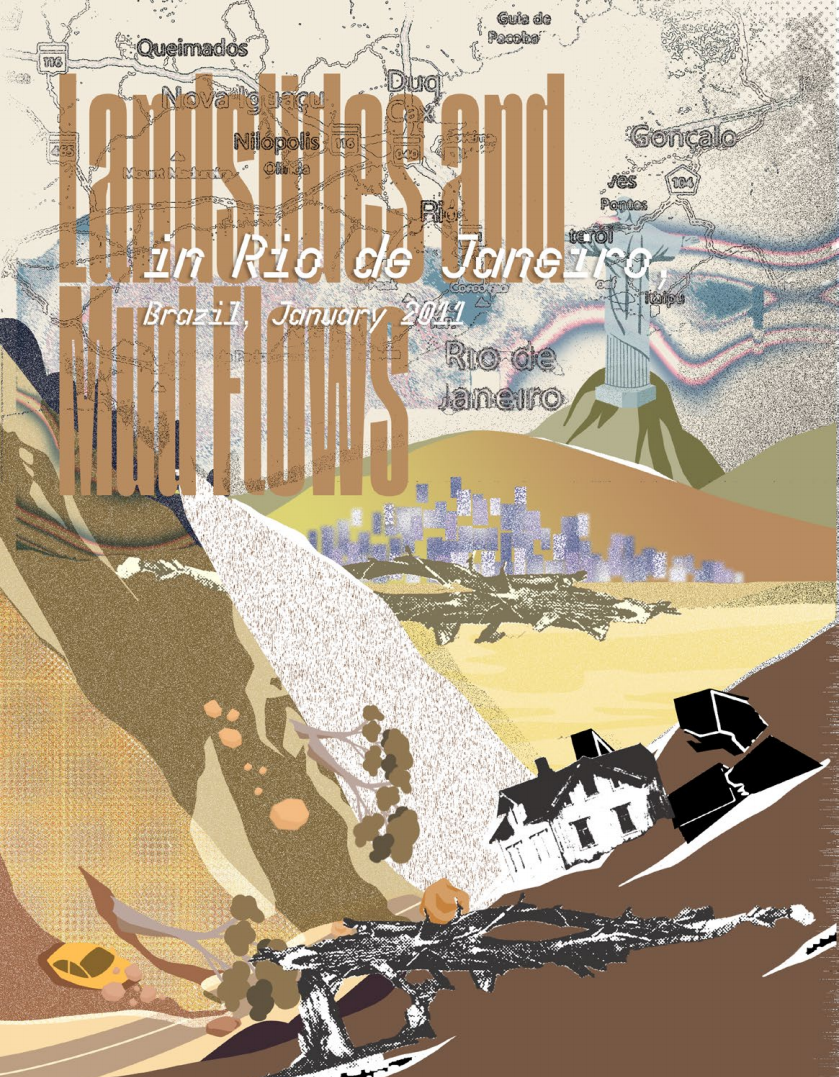
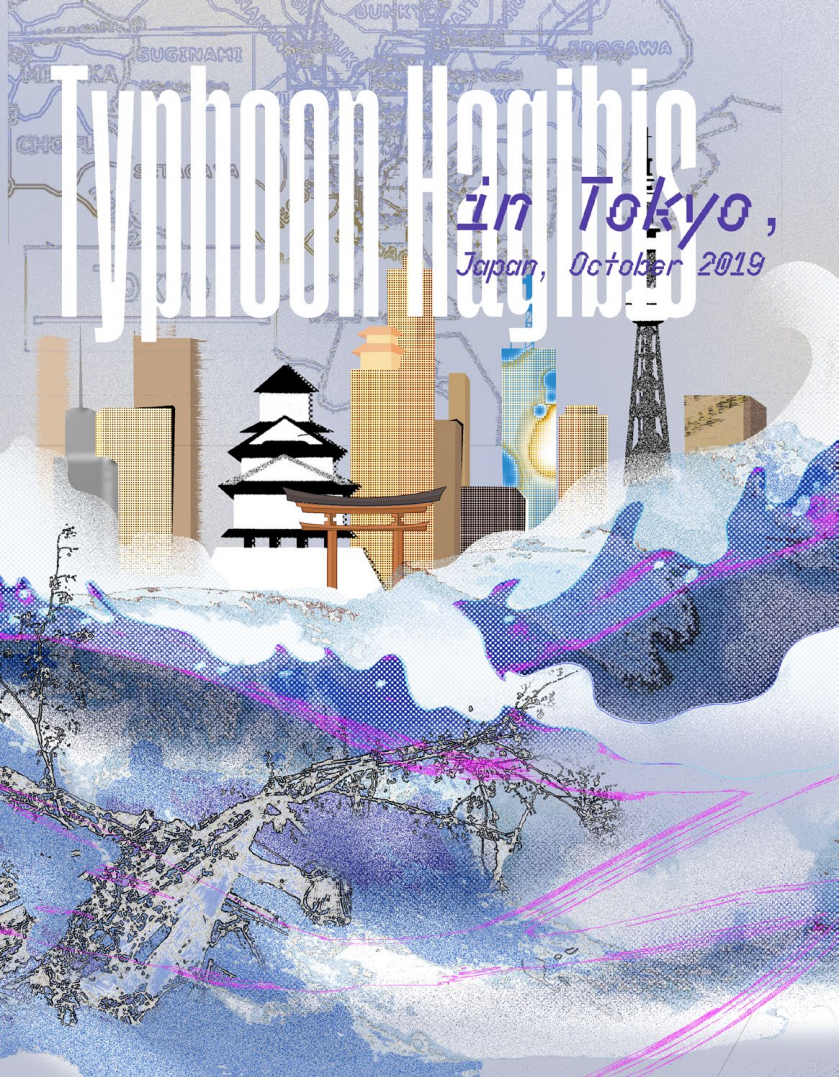
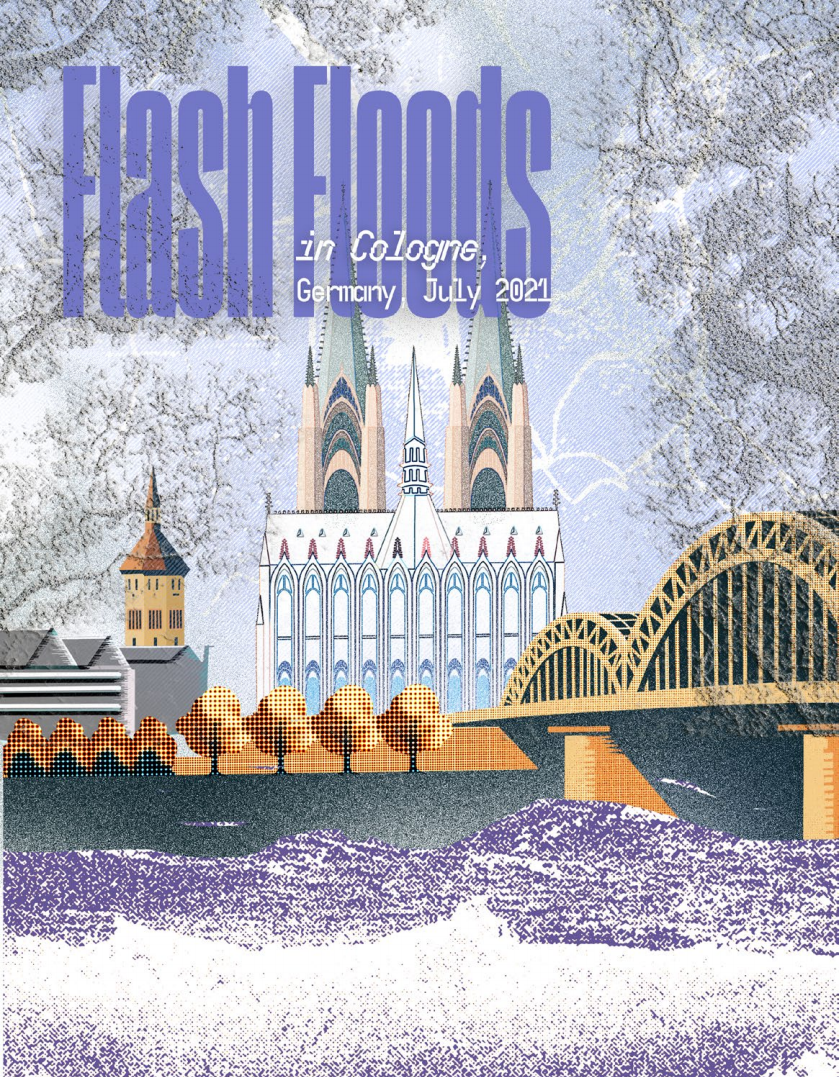
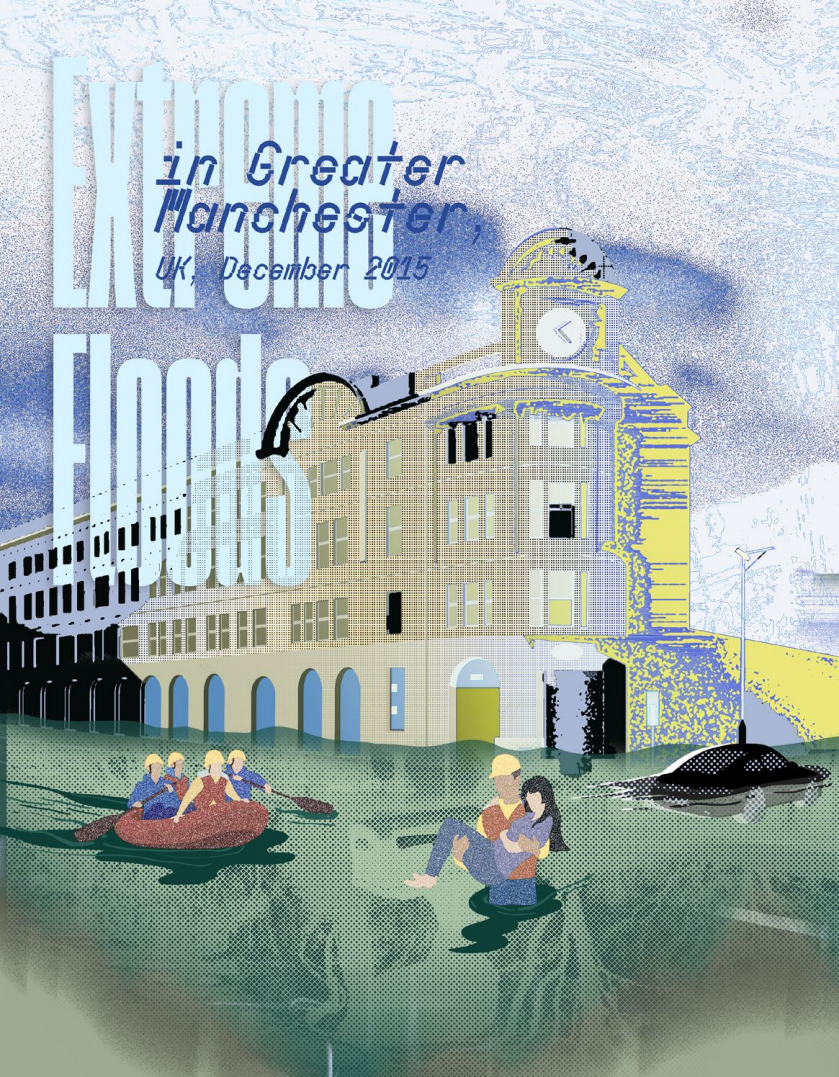
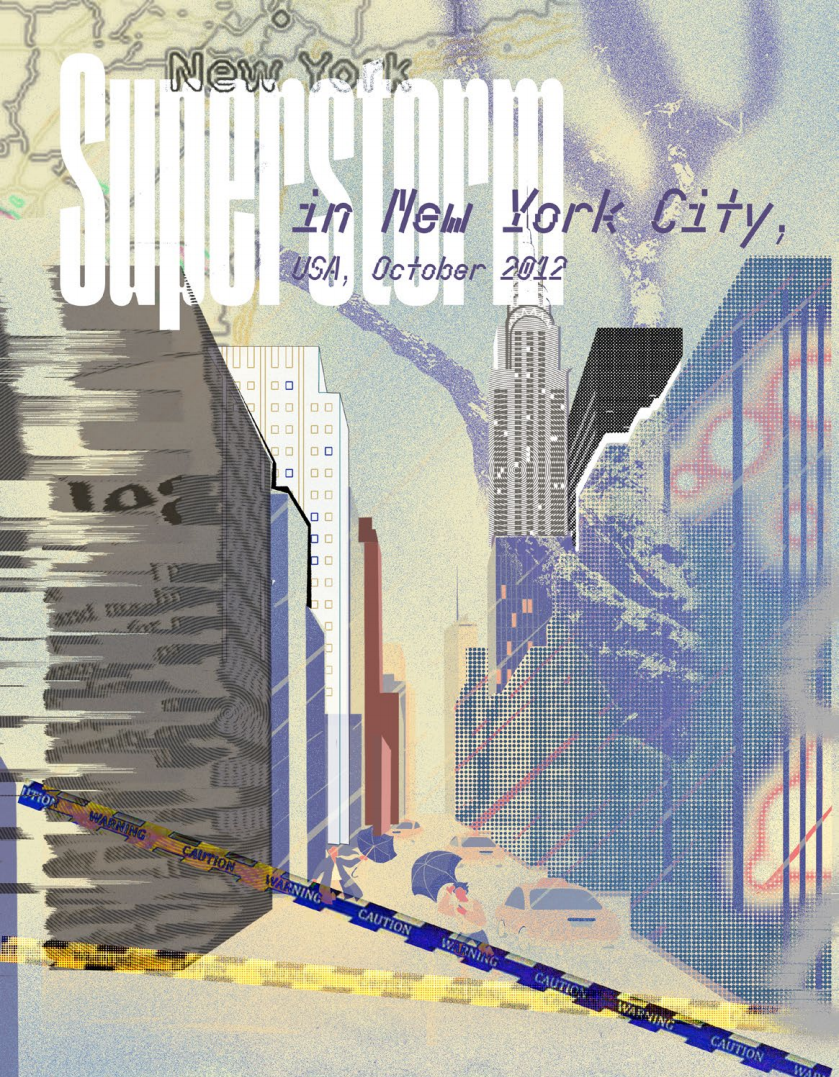
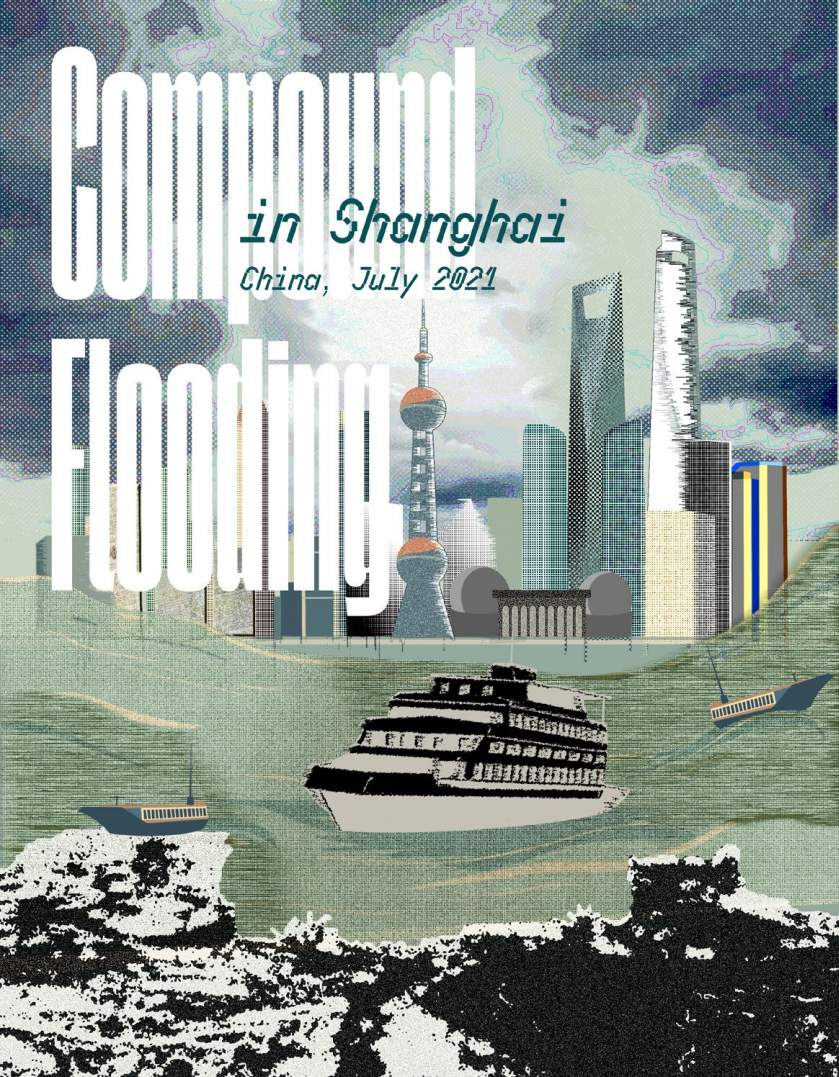
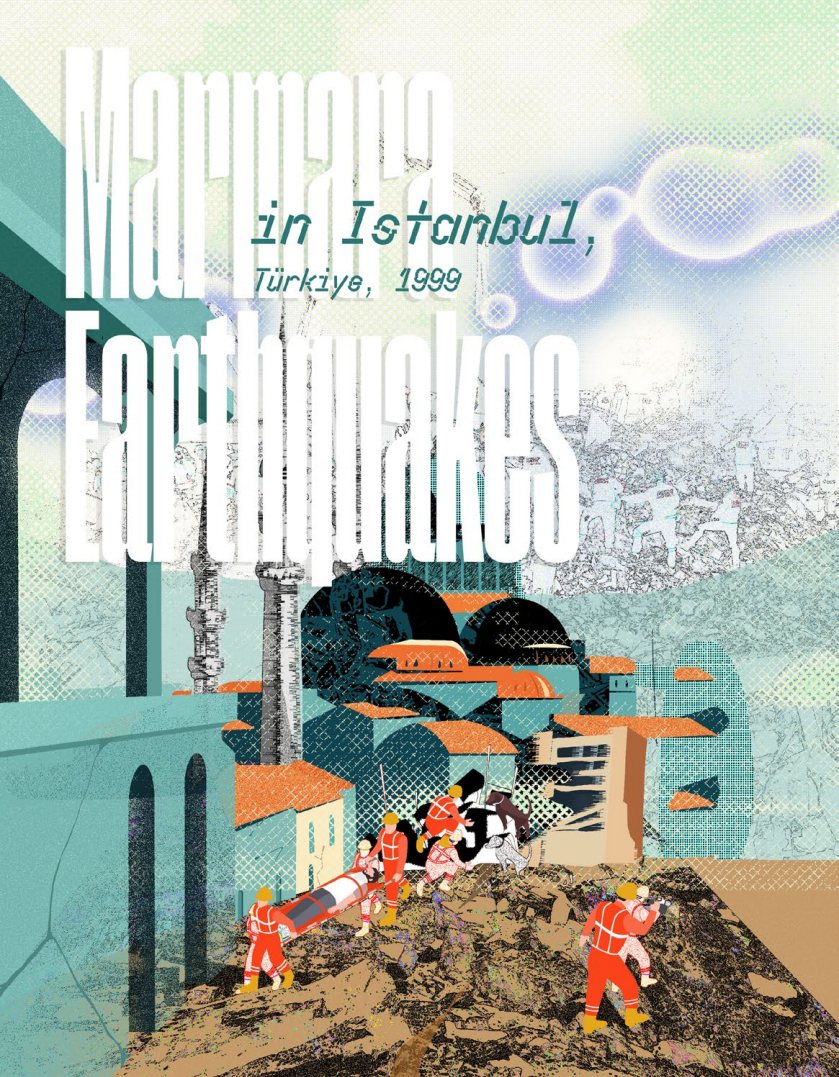
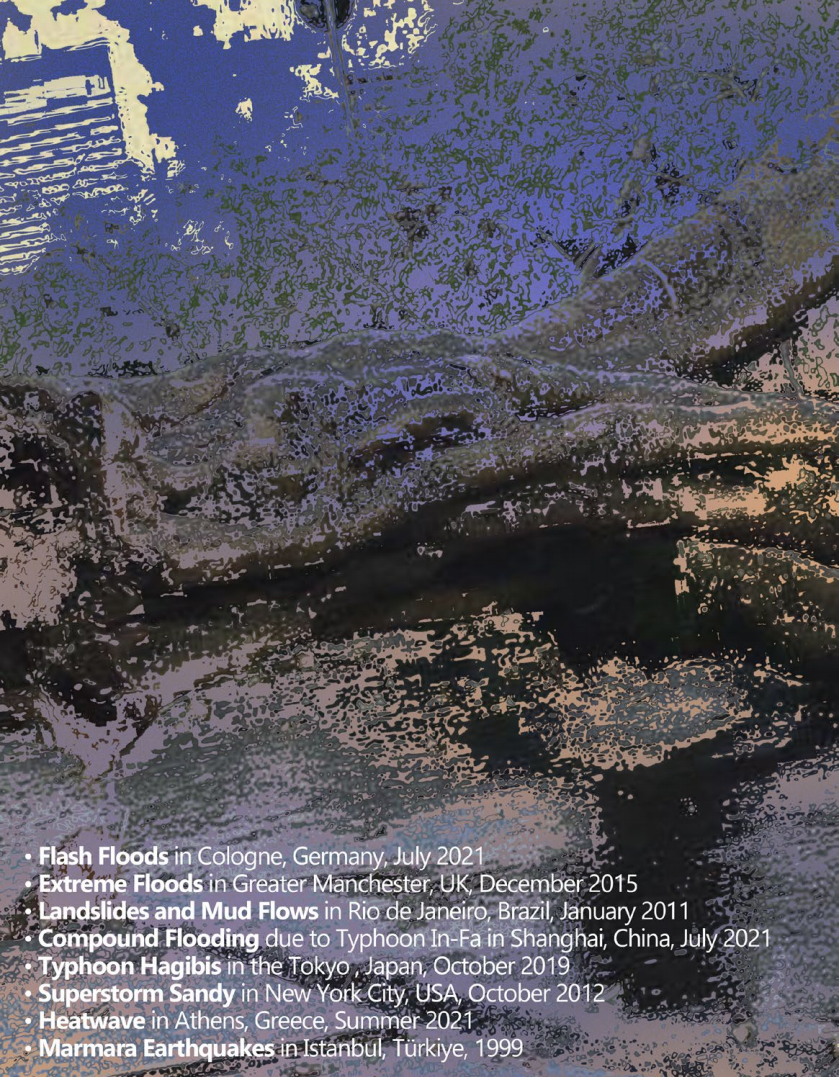
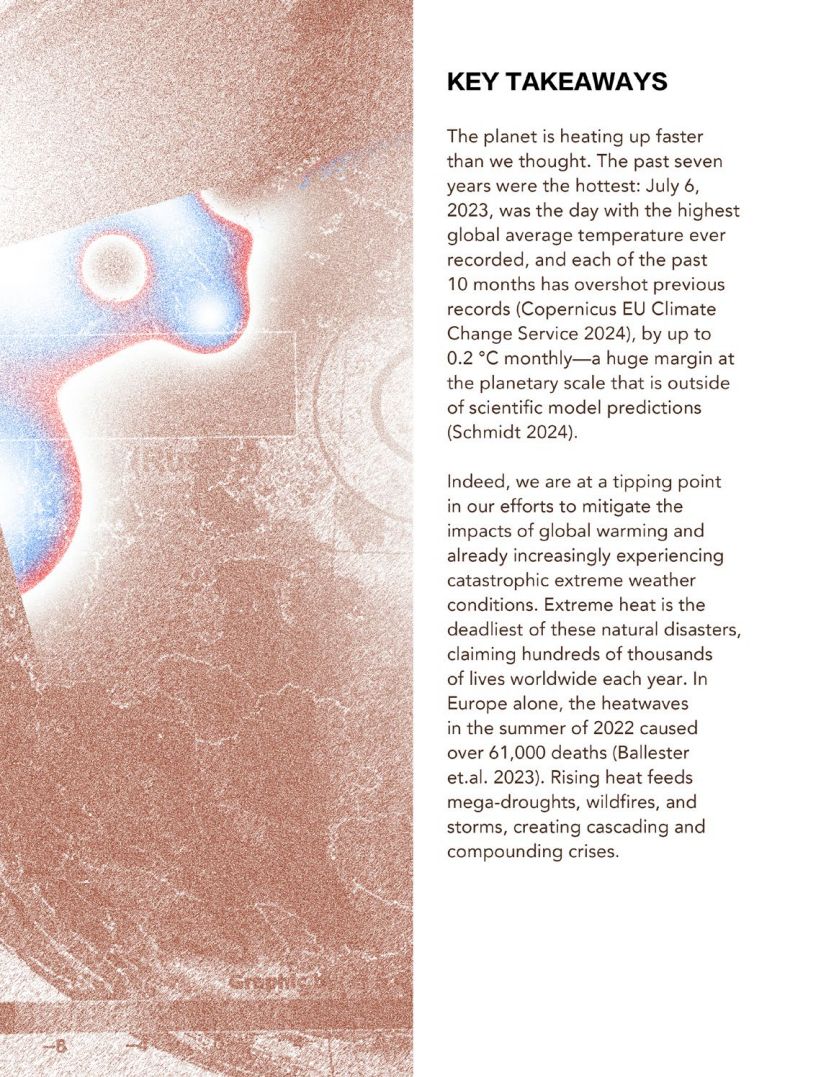
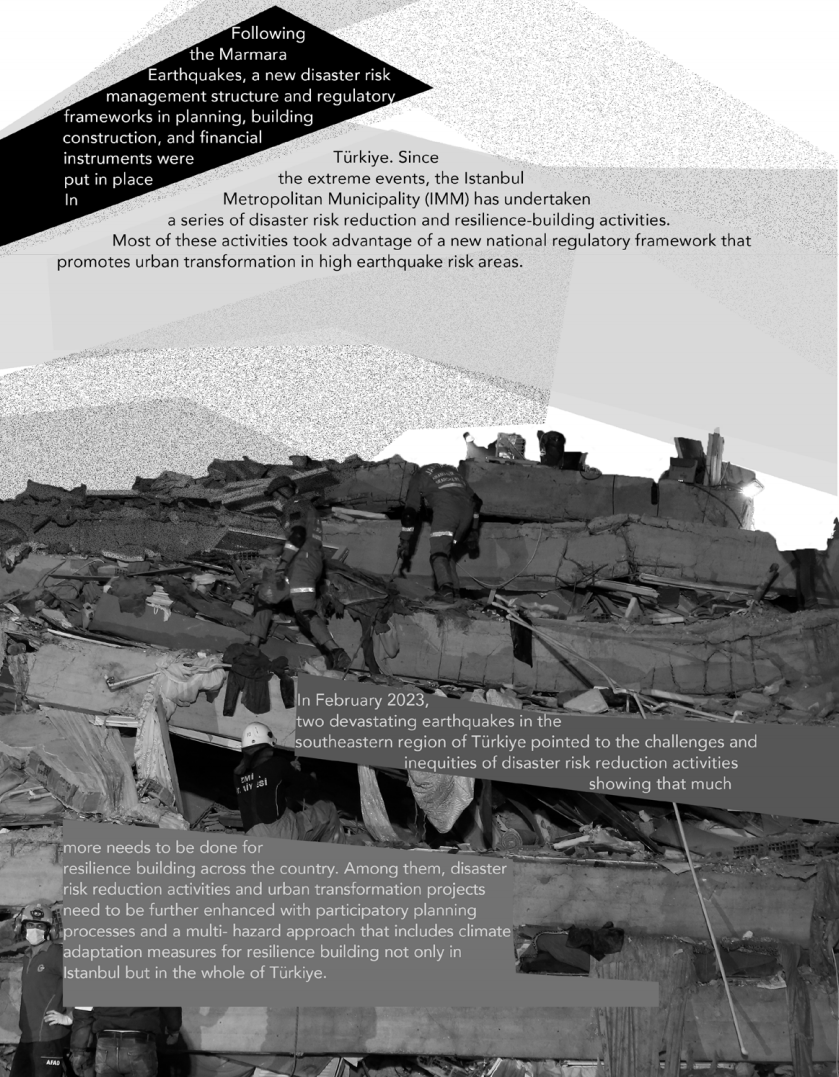
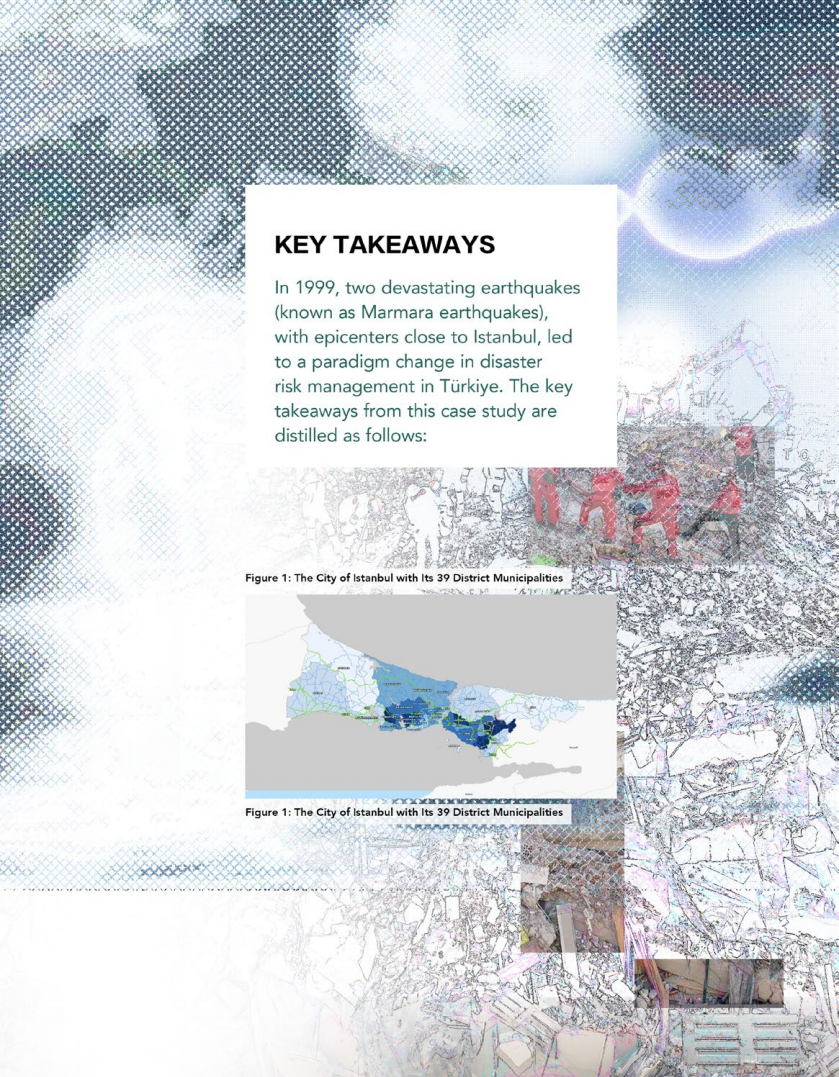
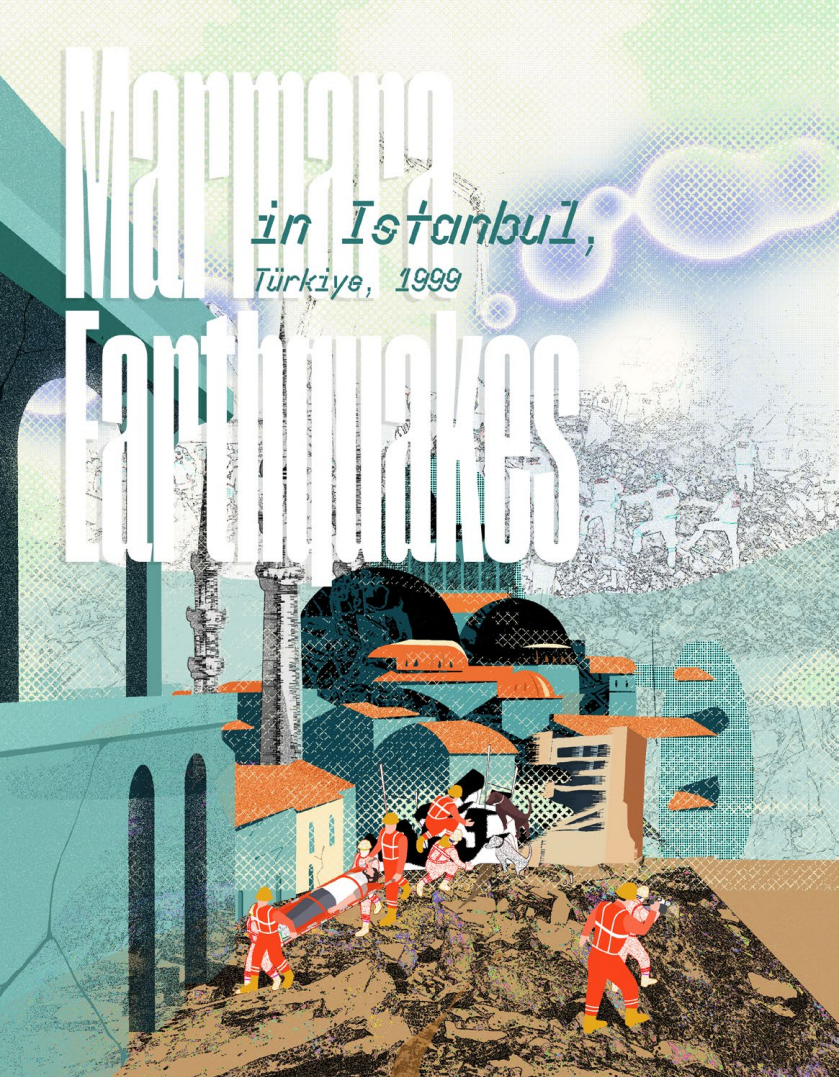
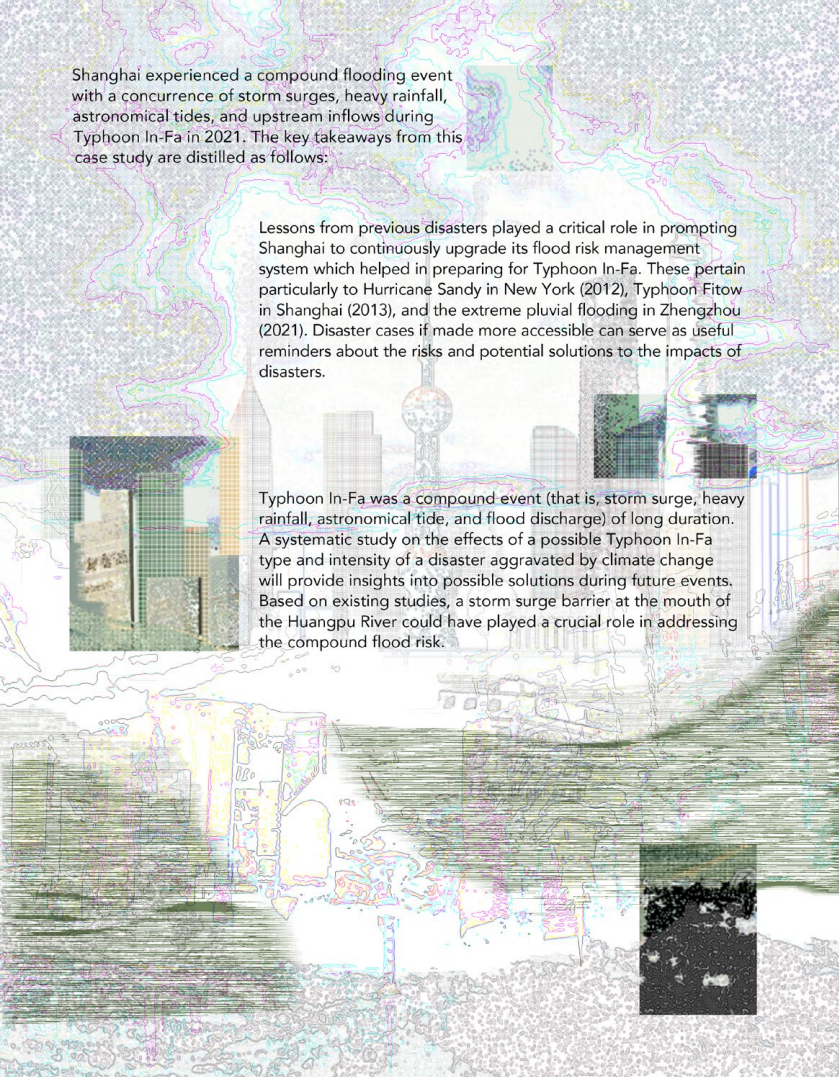
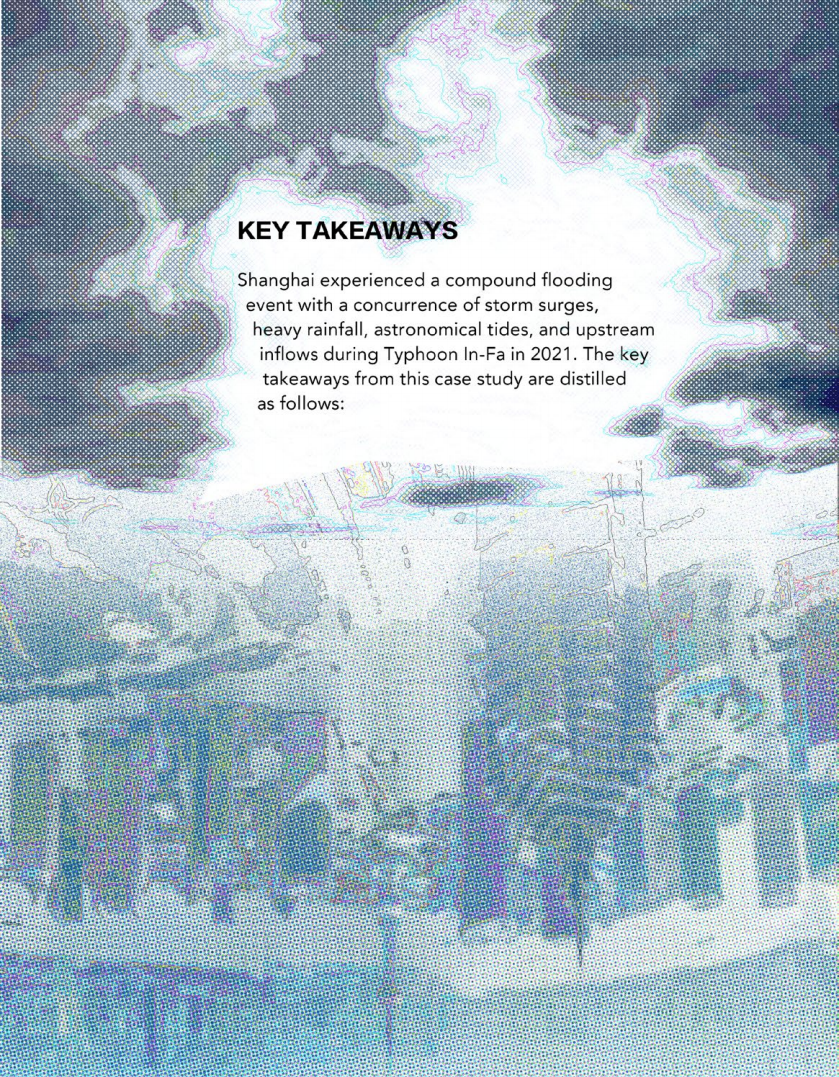
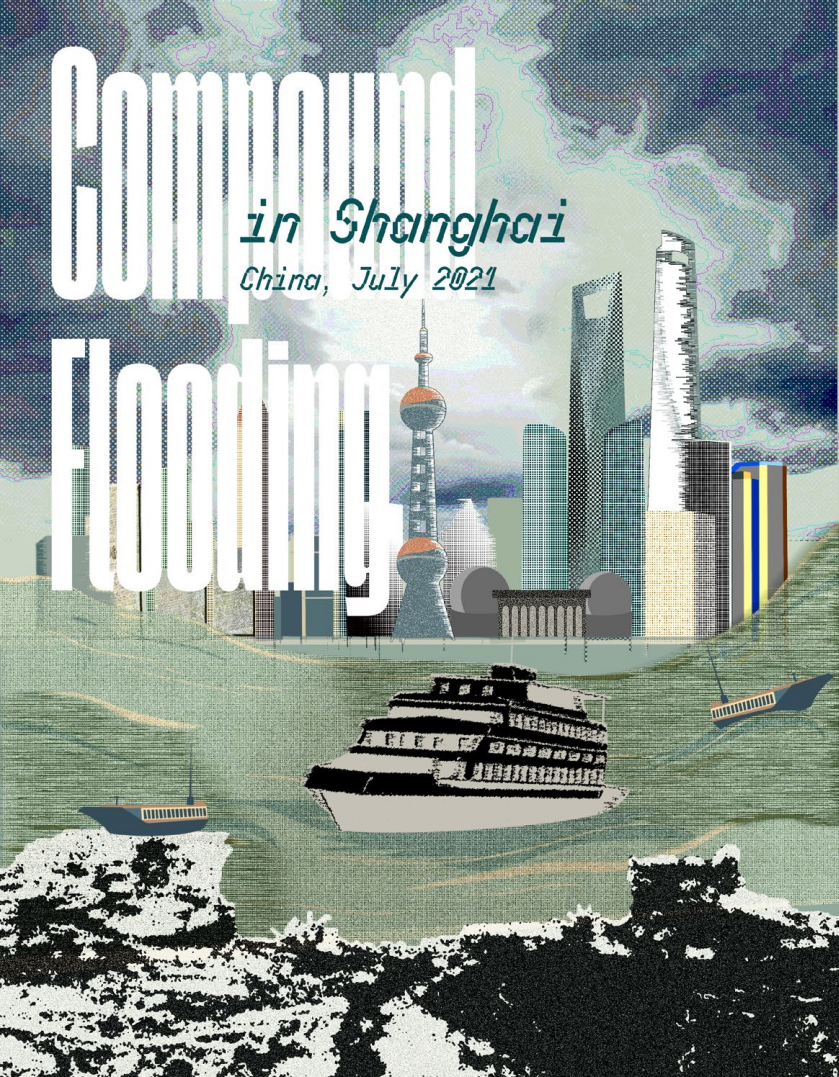
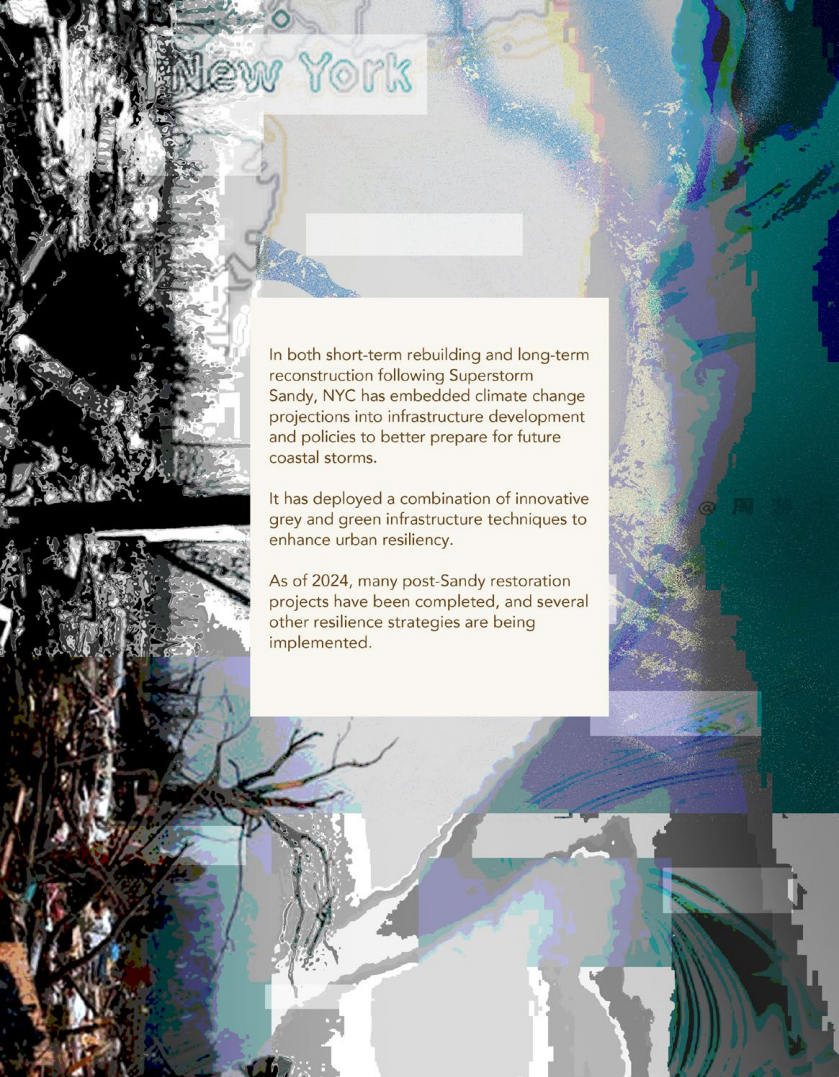
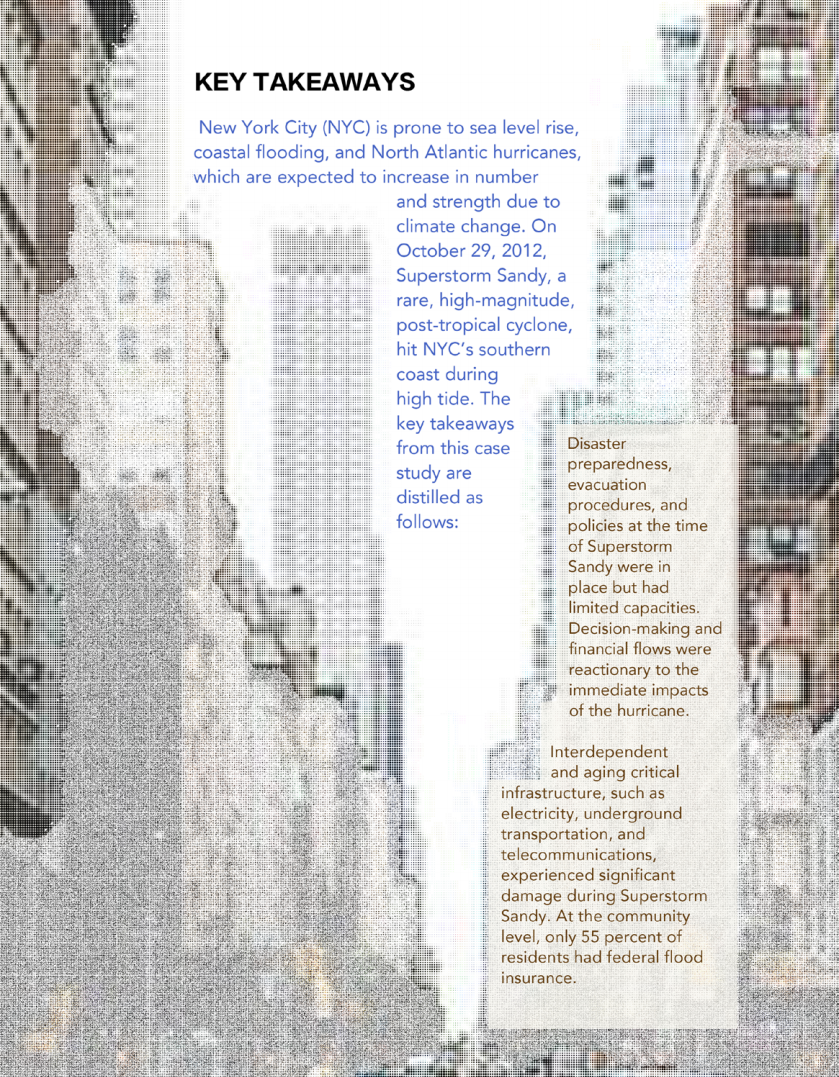
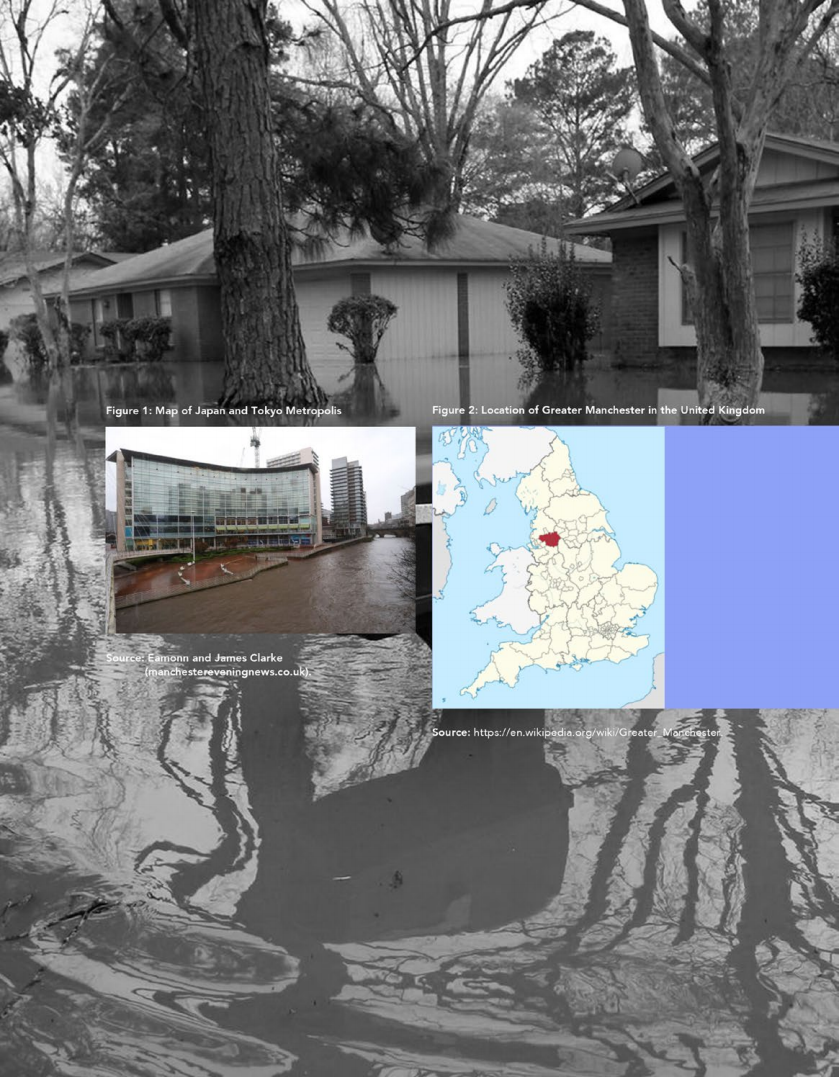
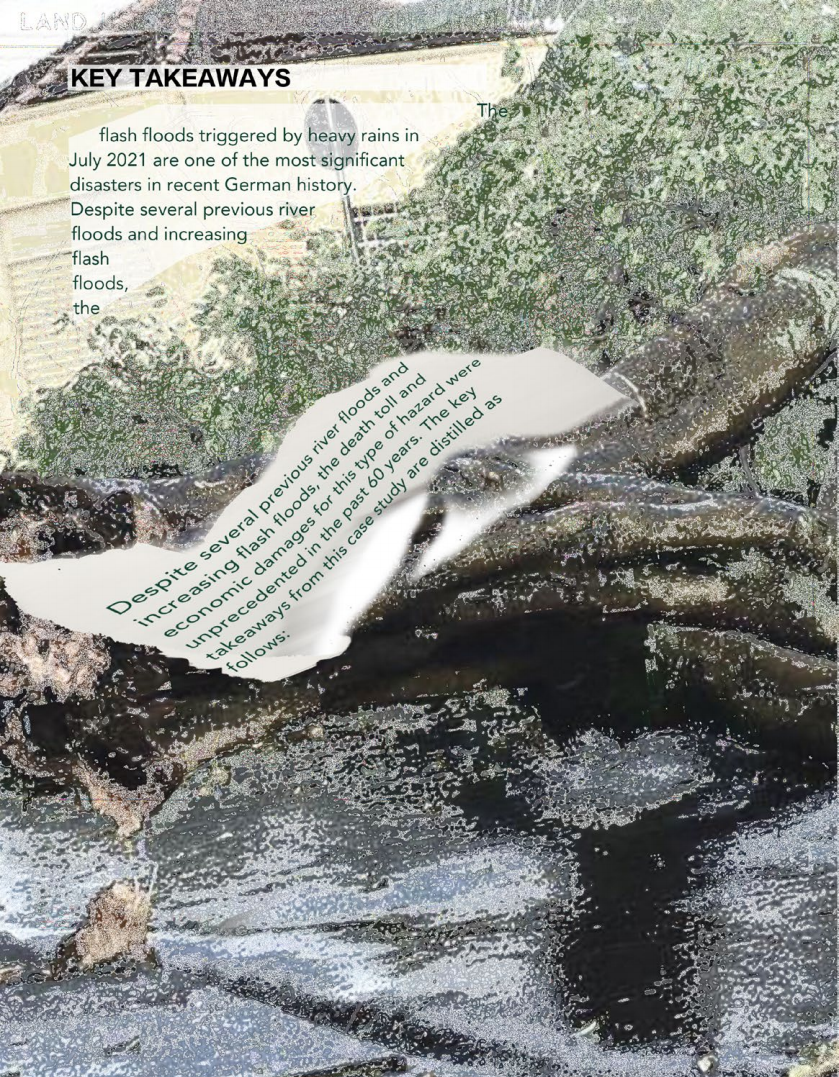
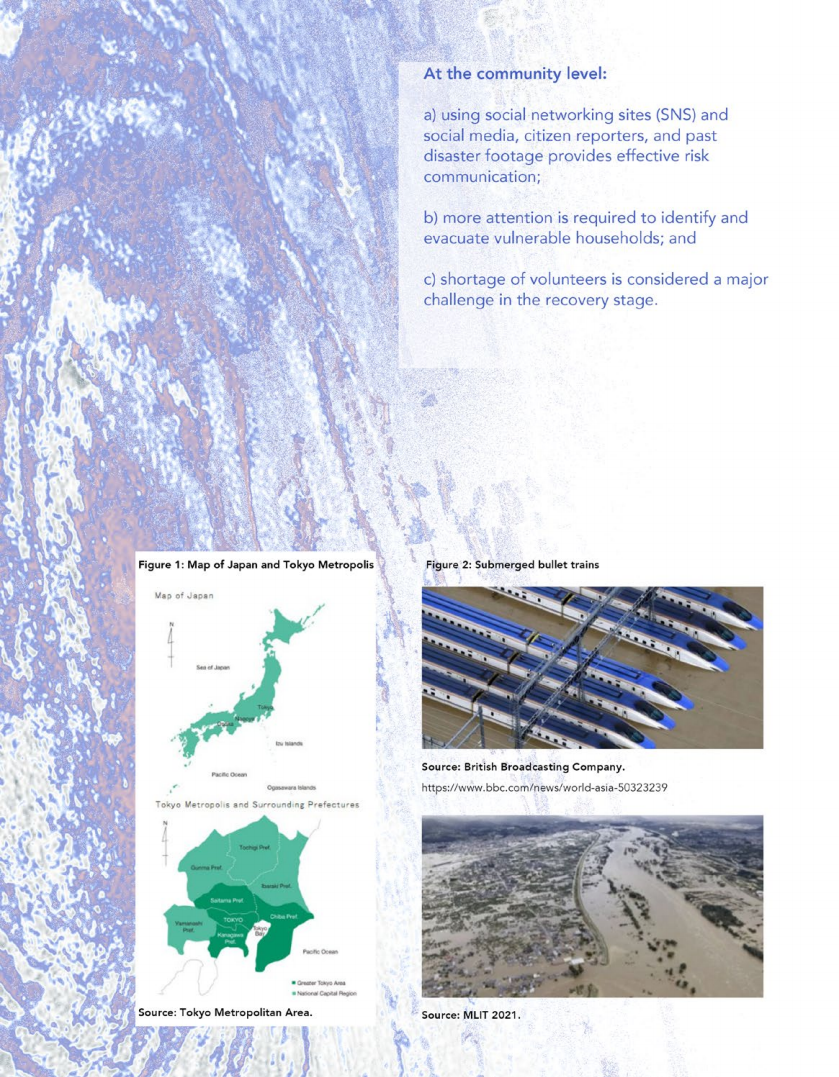
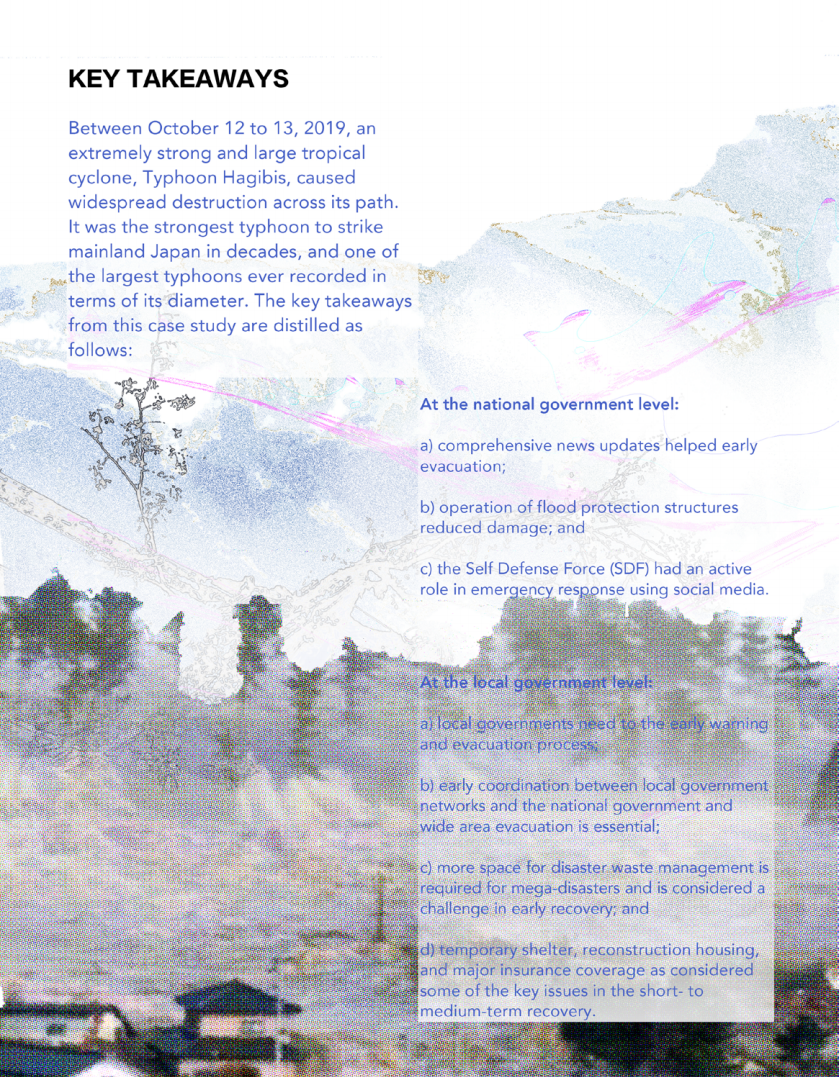
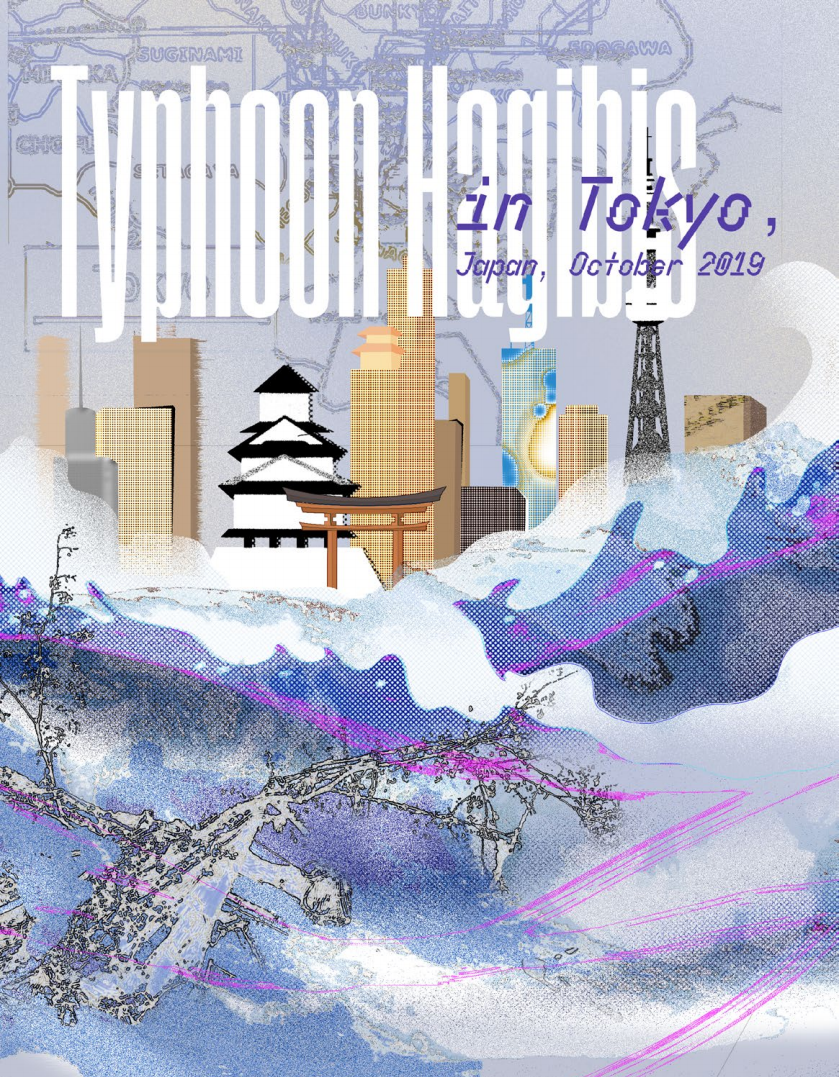
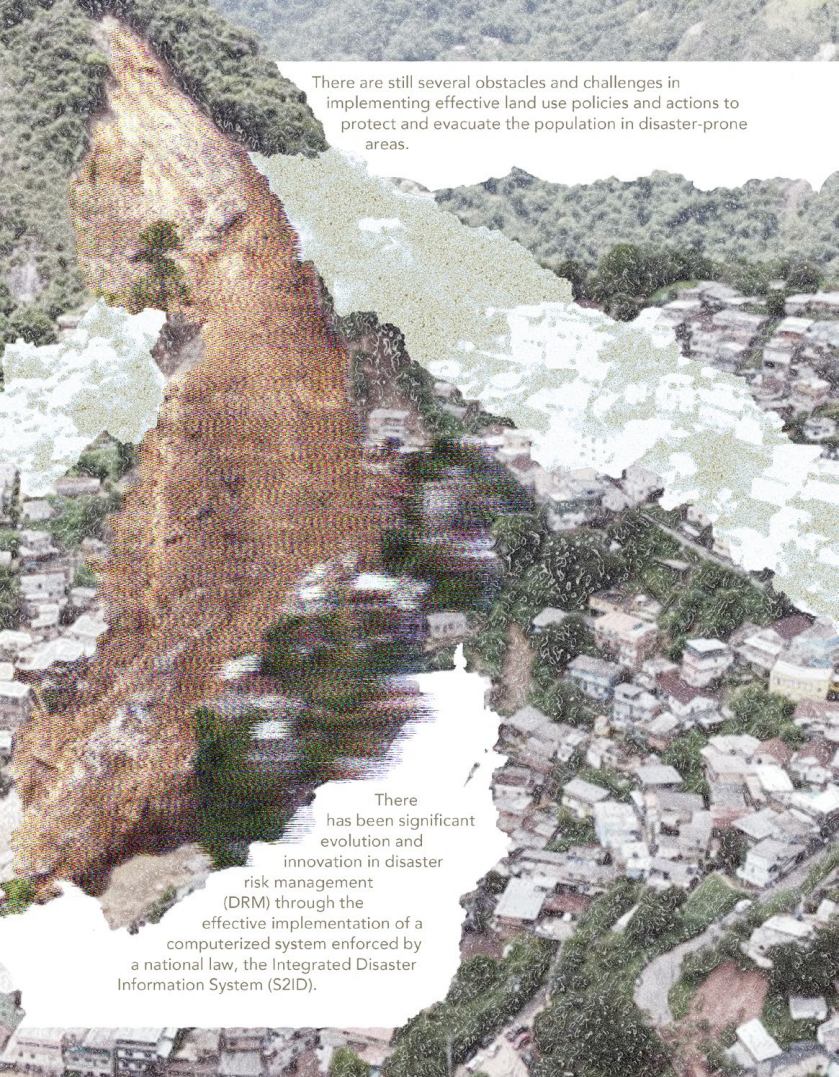
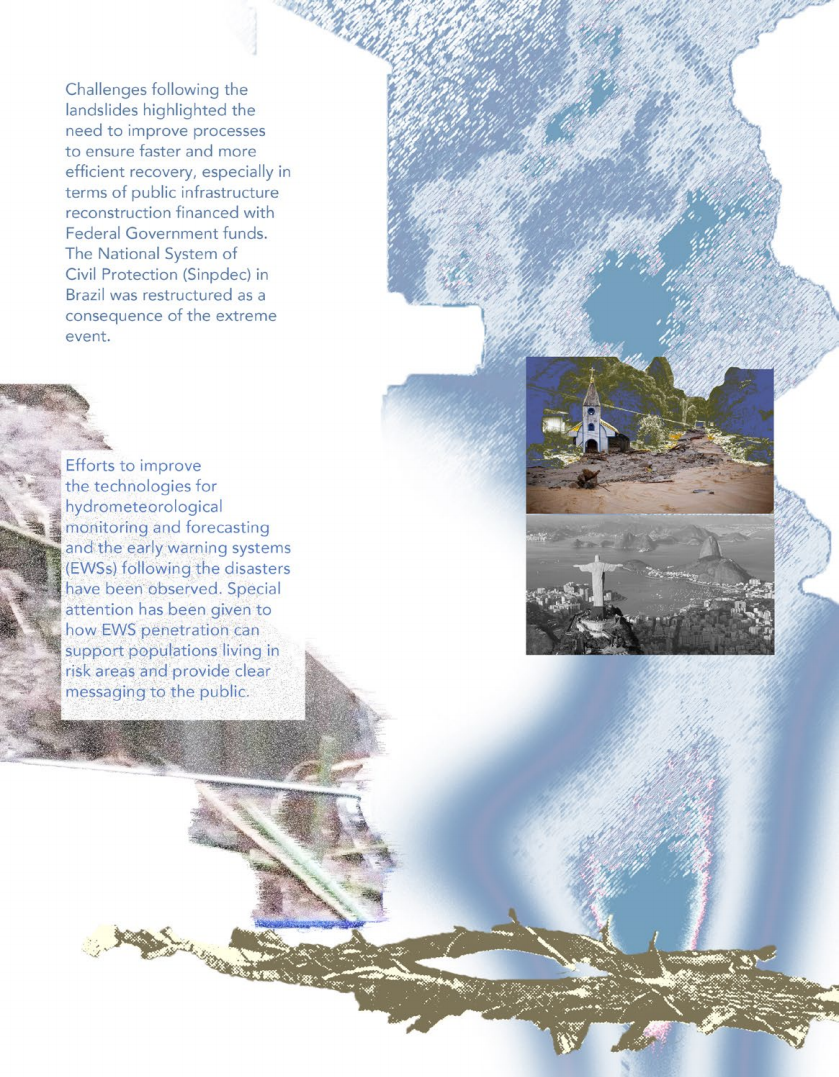
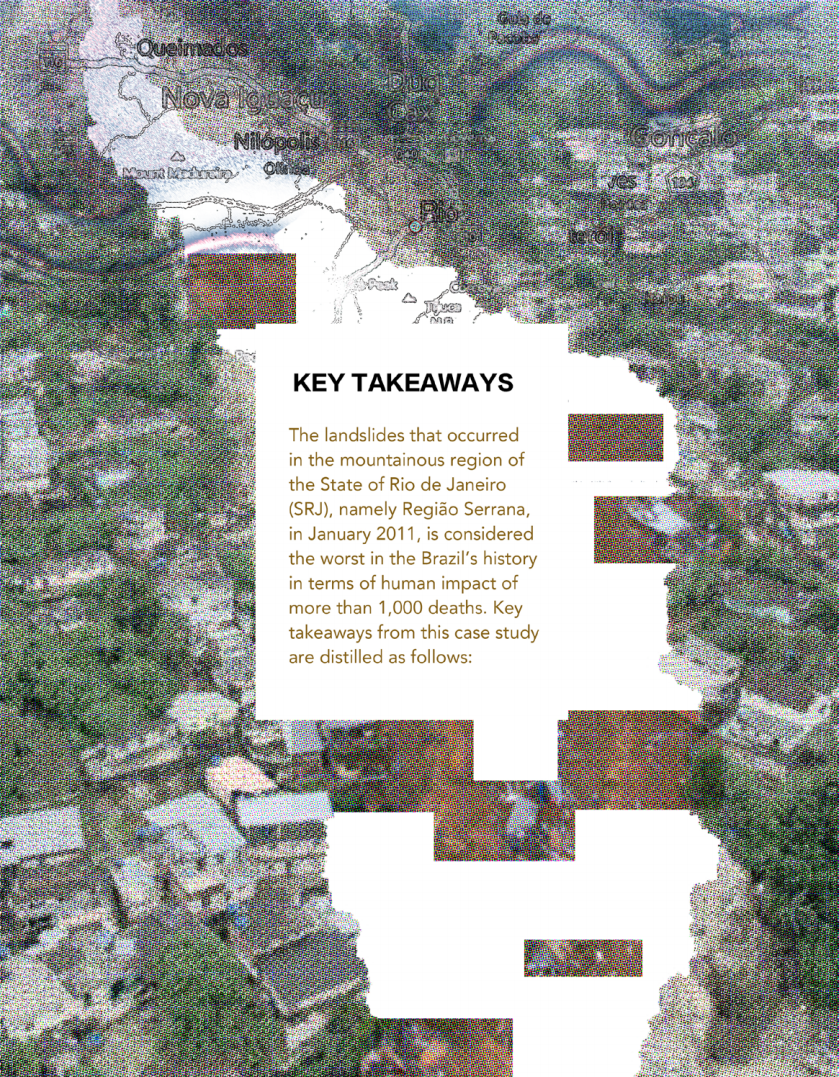
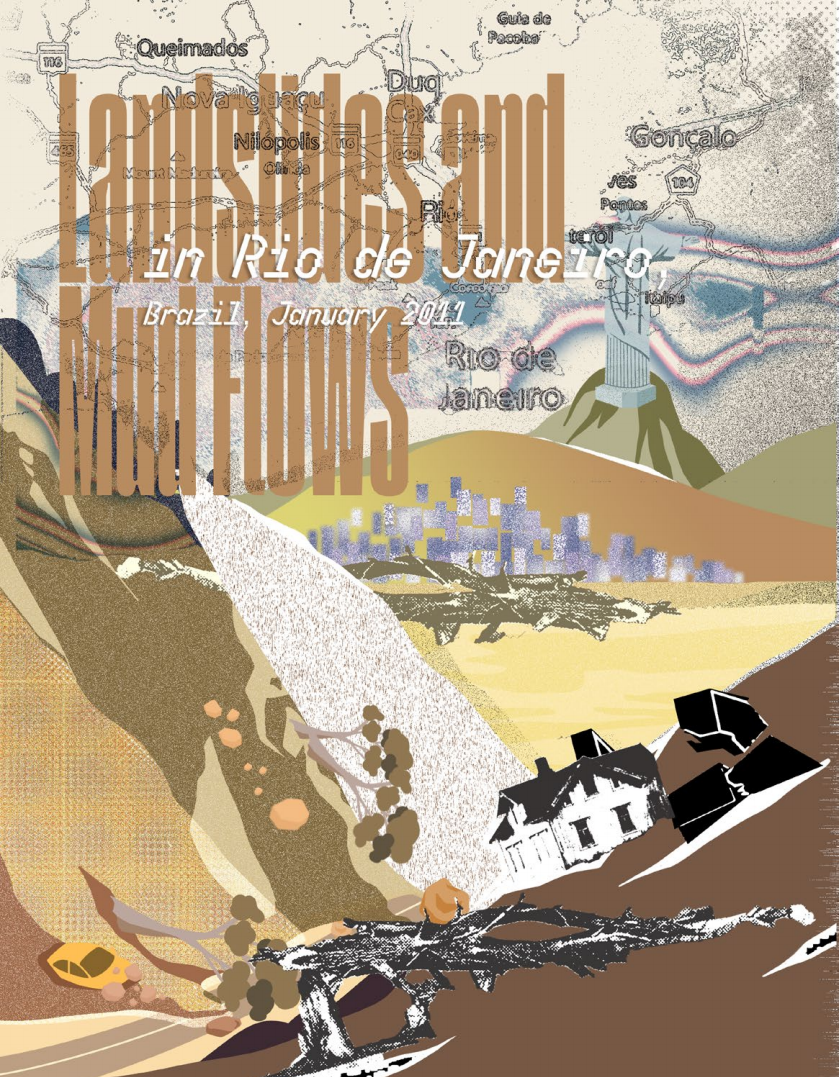
Based on public World Bank research, the project follows eight cities across Asia, Europe, North and South America. Architecture, cartographic textures, archives, typography and digital illustration form layered narratives that move between graphic design, information visualization and artist publishing.
The book turns scientific knowledge into an embodied visual encounter. Each page is both evidence and atmosphere: a way to travel between local events while recognizing a shared global archive.
01 / INTRODUCTION
Research distributed
across a visual atlas.
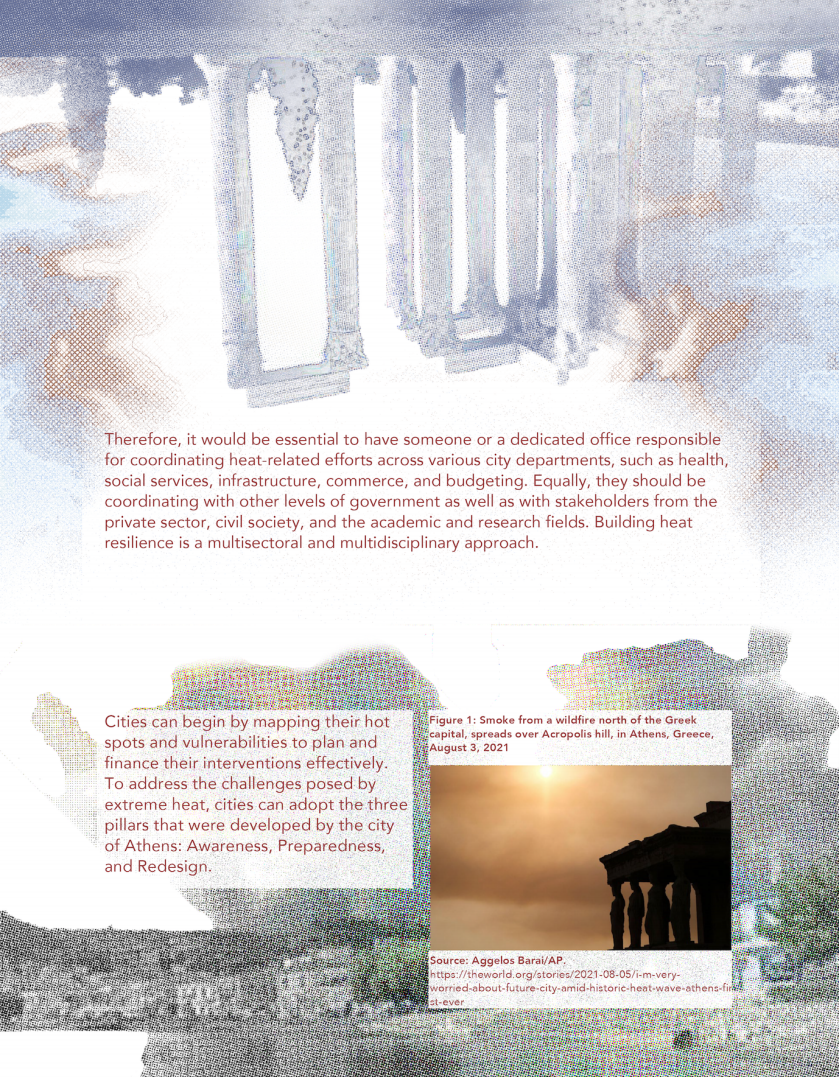
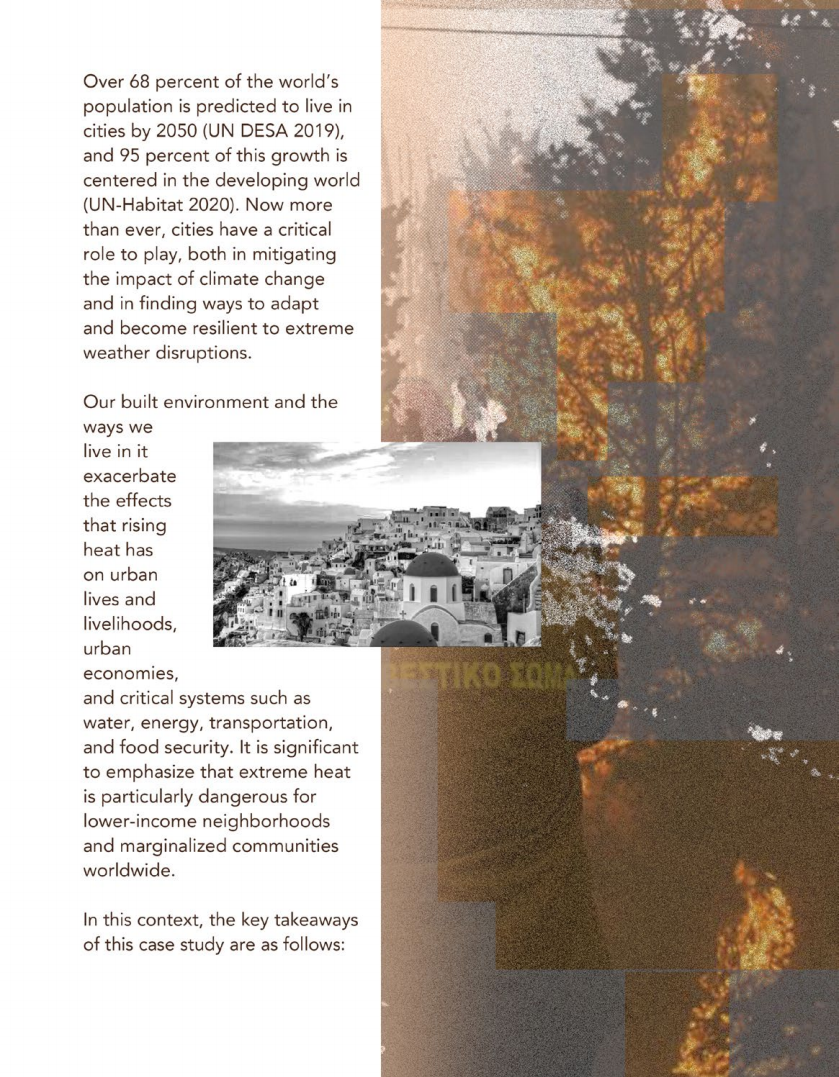
02 / STRUCTURE & VISUAL SYSTEM

ENGLISH PROJECT BOARD / LAYOUT REFERENCE
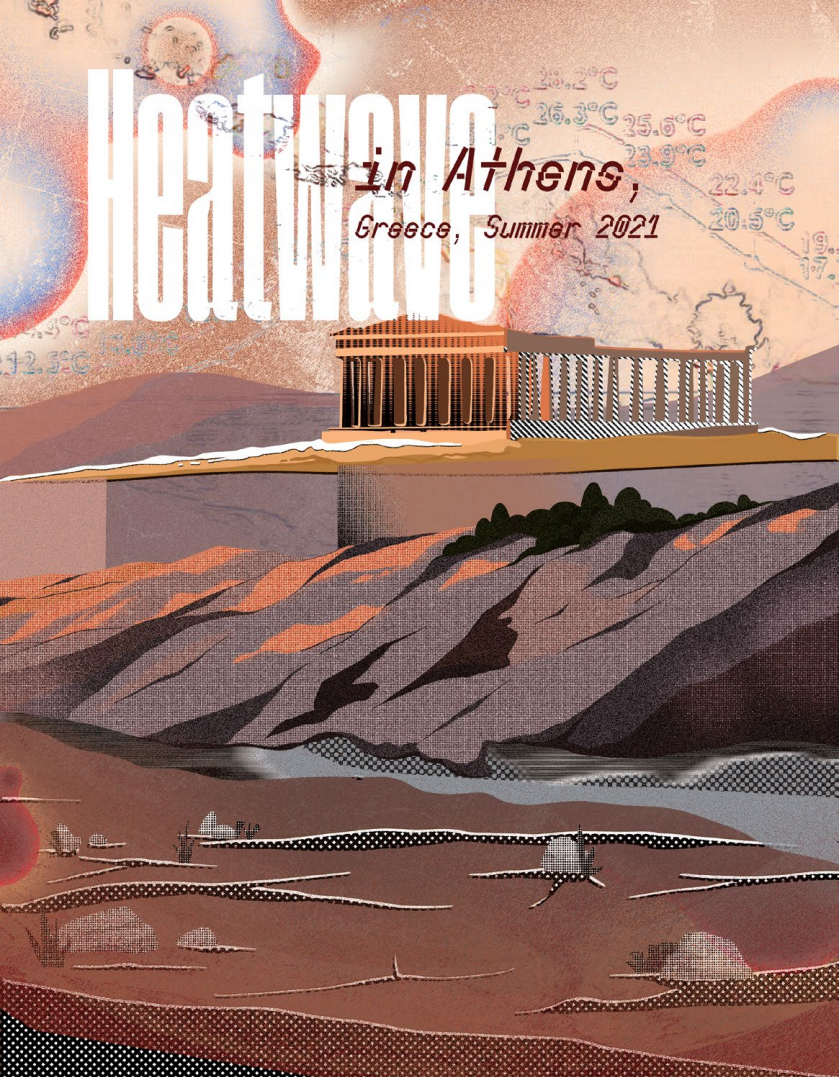
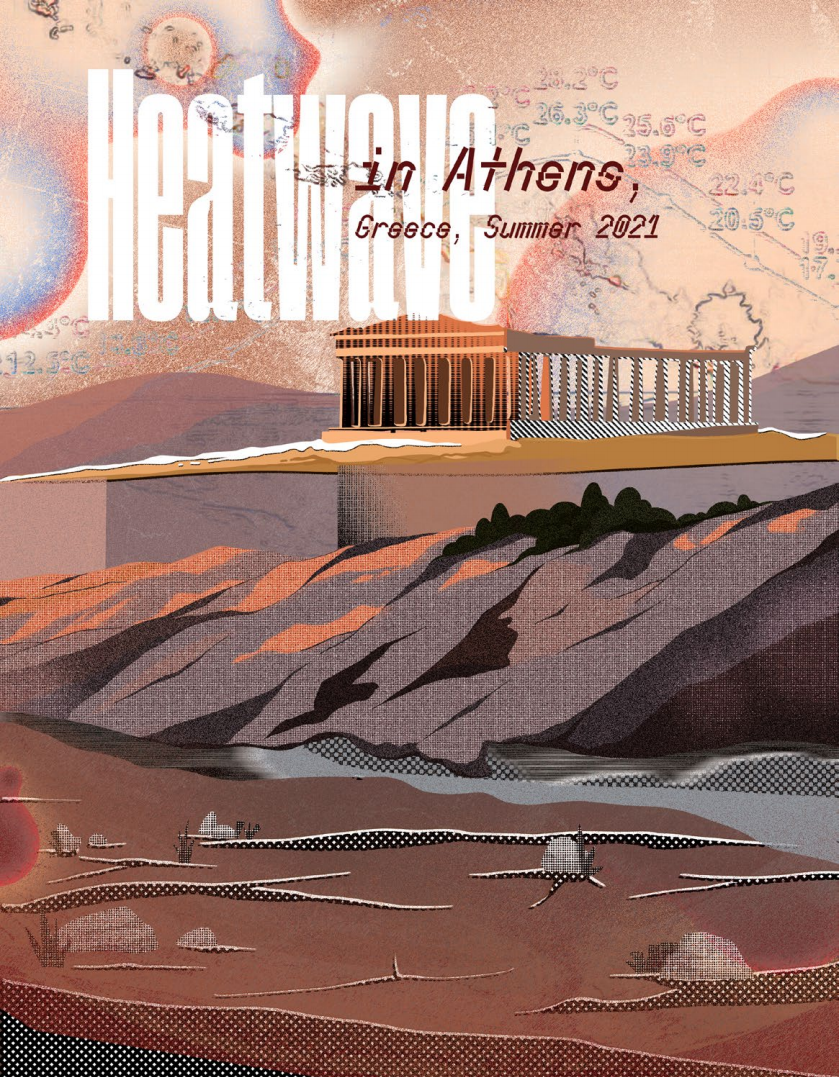
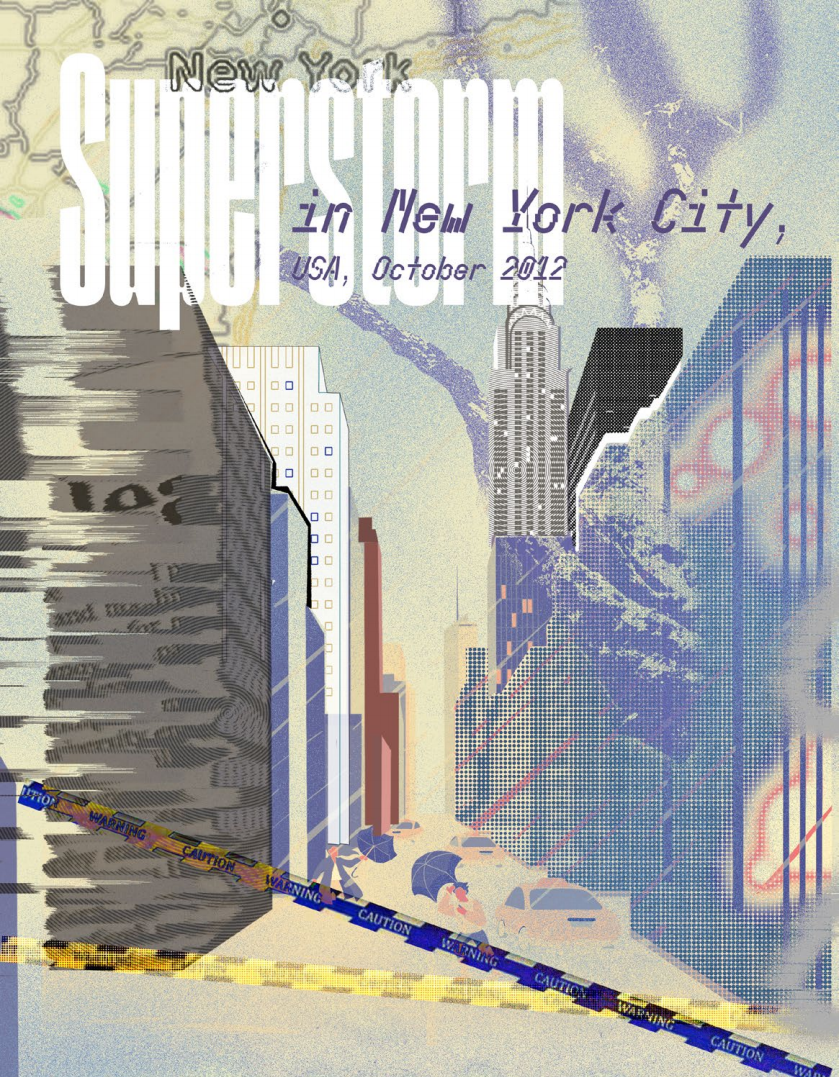
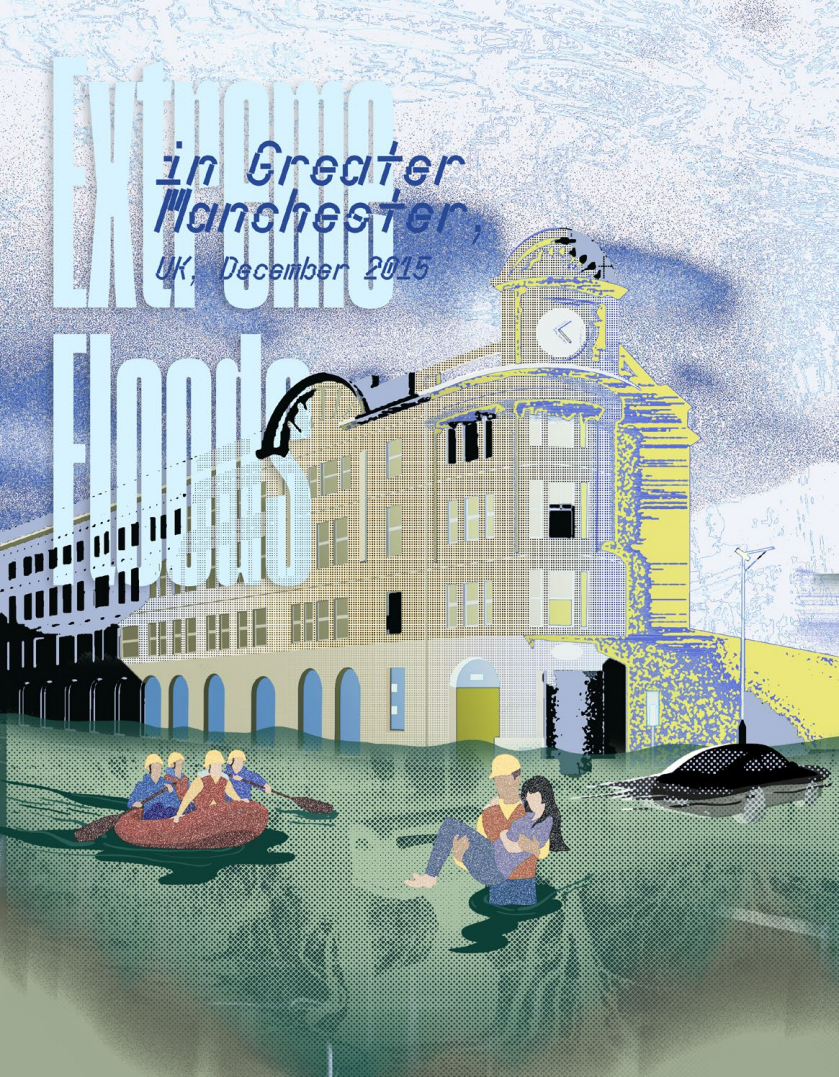
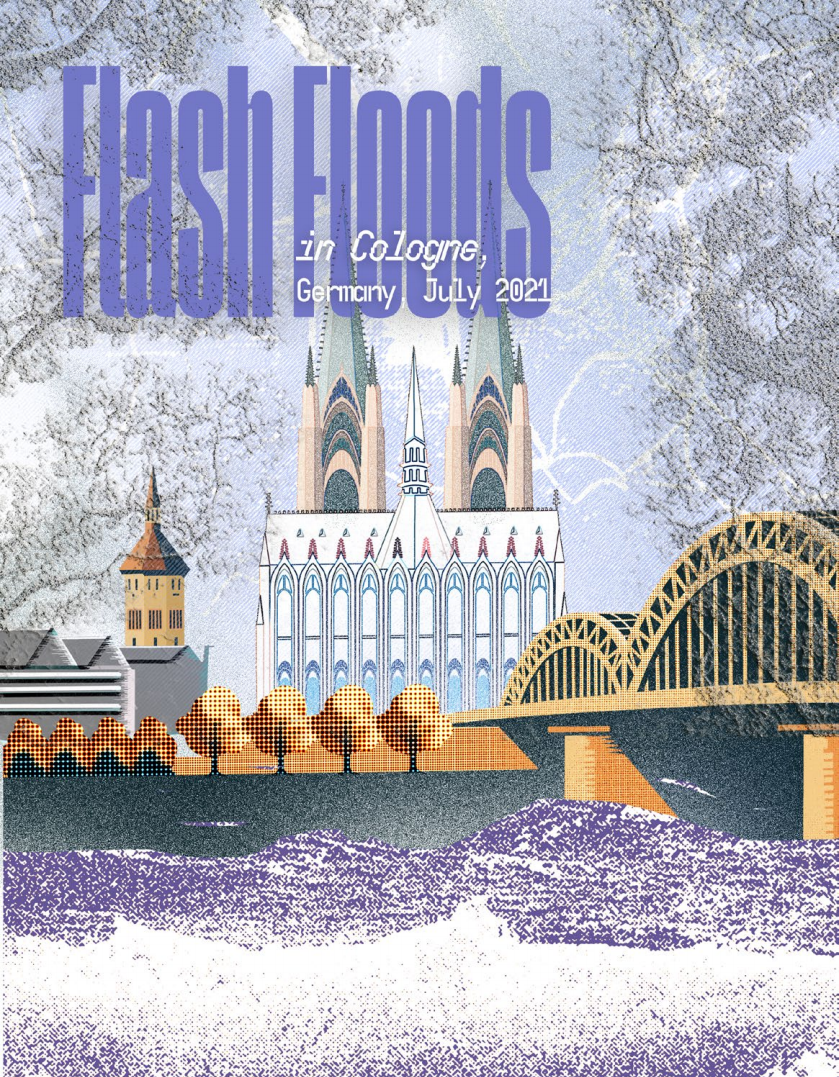
03 / COVER DESIGN FOR EACH CITY
Eight cities One entangled climate